07 Jul 2021
Network monitoring dashboard brings you “at a glance” a view of your network data. Often, data is spread out across different modules, making it difficult and time consuming to find the metric or KPI you might need. Also, organisations require efficient systems to automate repetitive tasks and to get the most out of their network inventory data.
What is a network monitoring dashboard?
Network monitoring dashboard gives you a unified view of different components, allowing you to easily find and analyse all the data related to your network performance, inventory, or usage data, among other parameters. It is also a well known fact that dashboards are highly useful to predict trends and detect failures at an early stage.
Why a network management dashboard?
- Unified view of your data, usually dispersed across different modules.
- Time savings. Easily accessing your data.
- Faster response and troubleshooting time.
- Advanced and specific reports with current and historical data.
- Customised view according to each professional profile.
- Improved performance analysis.
- Security improvements.
What no one tells you!
Organisations worldwide invest in expensive Business Intelligence tools because their NMS is not effective enough for their tracking/reporting tasks, key KPI’s for decision making, and neither does it offer them proper control panel options.
UX/UI is also important to keep in mind when analysing any dashboard available in an NMS´s market. User friendliness is a key aspect when setting up dashboards. Additional possibilities such as filters, exports, sharing options are important to evaluate as well.
Key aspects to setting up your network monitoring dashboard:
- Determine KPI’s and insights.
- Prioritise important metrics.
- Keep in mind medium and long-term use.
- Easy to use structure when adding components and building a dashboard.
- Real time & historical data.
- Assign permission according to each position profile.
- Export and sharing options.
- Download options.
What does SGRwin offer?
Our network management system offers you predefined and customisable dashboards. A wide range of options and components to add-on are also available.
An example of our network monitoring dashboard:
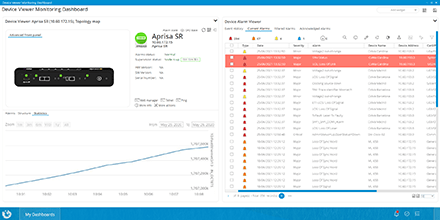
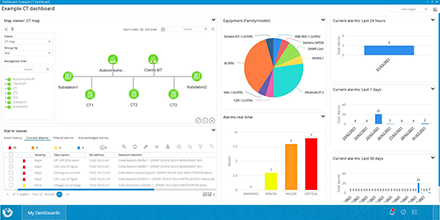
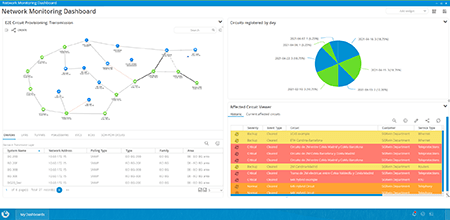
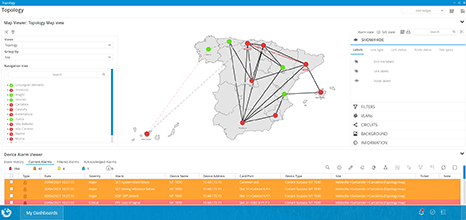
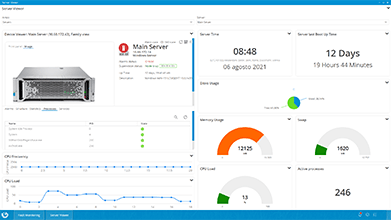
Depending on your needs, you will be able to select advanced or basic information to take in. The system enables you to incorporate charts, tables, or counter reports, among other options. This way you will be able to easily integrate your network monitoring dashboard data related to network performance, alarms, events, equipment, units, circuits, inventory, etc.
Our solution is not just simple, it brings you an advanced Business Intelligence tool for your Dashboards – an all in one solution.
Highlighted characteristics:
- Easy to use.
- Drag and Drop elements.
- Filters available.
- Supporting hundreds of exportable reports.
- Numerous component selection according to your needs.
- Modern Look&Feel.
- Access authorisation management.
- Shortcut available.
- Real-time and historical information.
Ready to transform the way you manage your network?